The Red X that Says What it Saw


Introduction
A failing CI check knows exactly what went wrong. It was there. It watched the exception get thrown, caught the stack trace, wrote the whole thing down. And then, by long tradition, it tells you almost none of it: a red X, a job name, and an invitation to go read the logs yourself.
Our CI bot has commented on pull requests in gradle/gradle for years: triggering builds on request, shepherding the merge queue, answering commands. In mid-July we gave it one more job. When a check goes red, it reads the failures out of Develocity, groups them, and posts a short summary on the pull request, so the red X finally has to say what it saw.
A real failure #
Take pull request #38047, a change that gives the Copy and Sync tasks a lazy destinationDirectory property. Additive, non-breaking, the kind of change you expect to sail through. Most of its checks came back green. One did not.
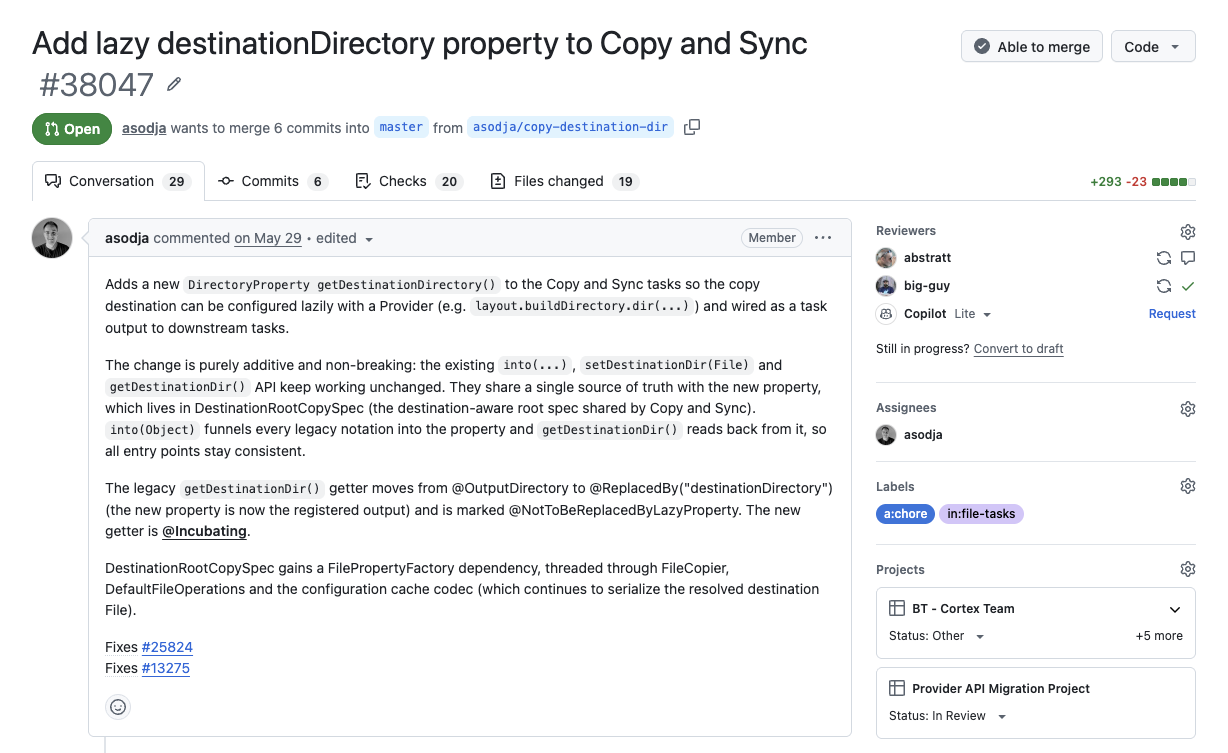
Here is what the bot left on the pull request:
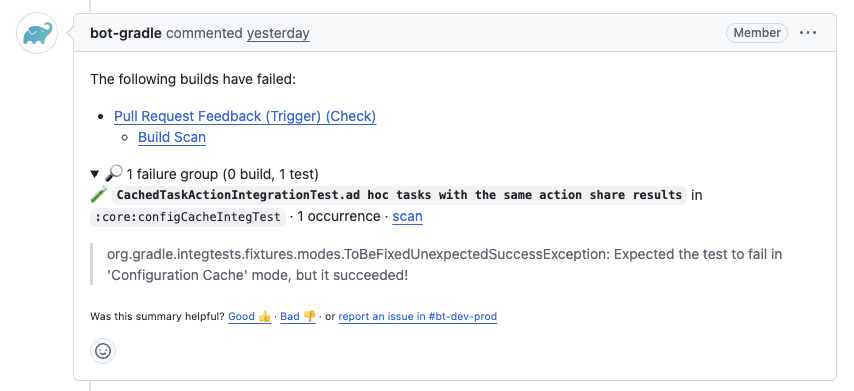
You can read the entire shape of the failure without opening anything. It is a single test, named in full: CachedTaskActionIntegrationTest, the case “ad hoc tasks with the same action share results,” in :core:configCacheIntegTest. And it is the good kind of surprising. The test was marked to be fixed: a known limitation, annotated as expected to fail under the Configuration Cache. Except it did not fail. It passed. Expected the test to fail in 'Configuration Cache' mode, but it succeeded! The change had quietly fixed something a stale annotation still insisted was broken, and the build stopped to point it out. The comment links straight into the Build Scan.
Open it, and the failure is waiting on the summary:
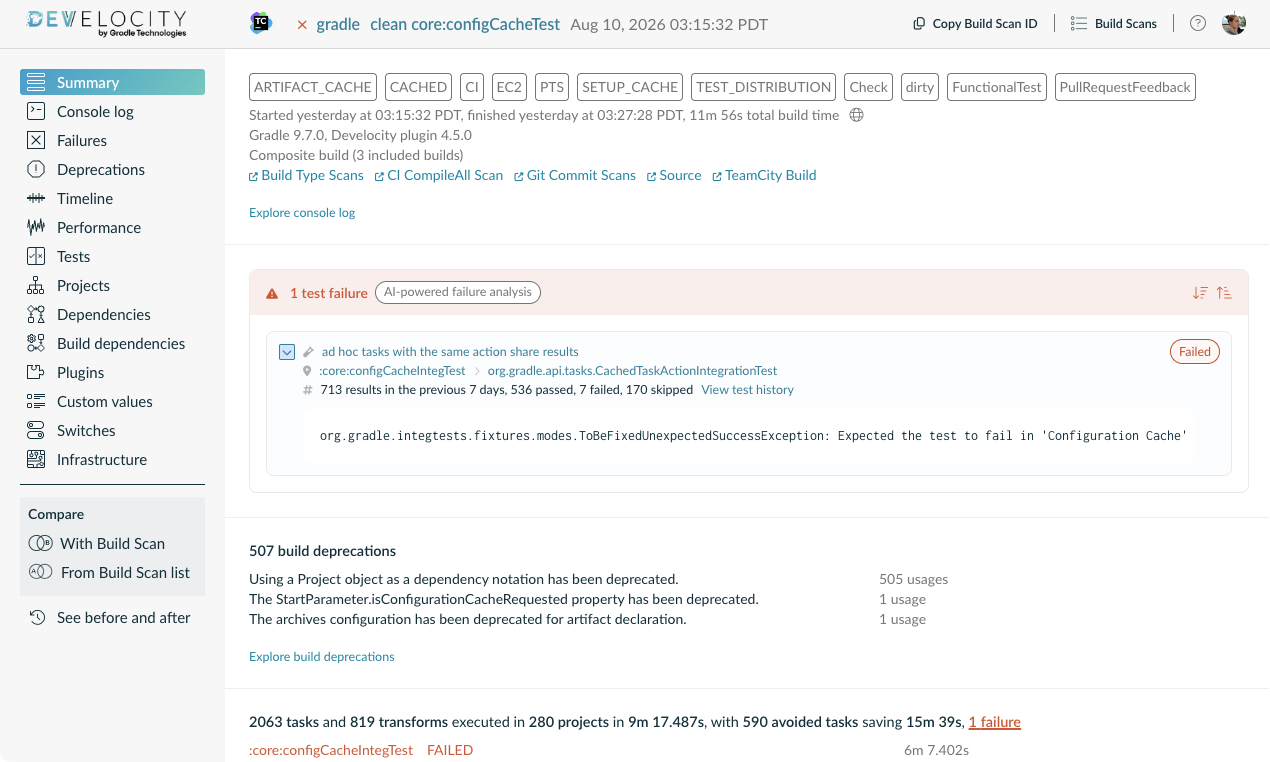
That is the Build Scan for the failing build, and the failure is sitting right in the summary: the same test named again, the ToBeFixedUnexpectedSuccessException spelled out, and, because this is Develocity, the test’s own history next to it: 713 runs in the last seven days, 536 passed, 7 failed. The comment is the headline. The Build Scan is the story. All the summary is trying to do is get you from “a check is red” to “here is the one thing that matters” without the detour through raw logs.
How it gets there #
Develocity has grouped failures for a while. It takes the many failures a build produces and clusters the ones that are, to a human, the same failure, across all the builds of a run rather than one at a time. That matters because a single gradle/gradle check is not one build. It fans out into dozens, across operating systems and test buckets, all of them reporting into the same Build Scan data. Grouping turns the same failure seen across many builds into one line instead of many. This example is a quiet one, a single test; on a worse day the same mechanism saves you from scrolling past one stack trace forty times.
The bot asks Develocity for the failure groups tied to the commit, then drills one level deeper, into a representative build’s failures, to recover the human name of the failing test or task. That detail is already sitting in the Build Scan, which is where the comment’s scan link drops you:
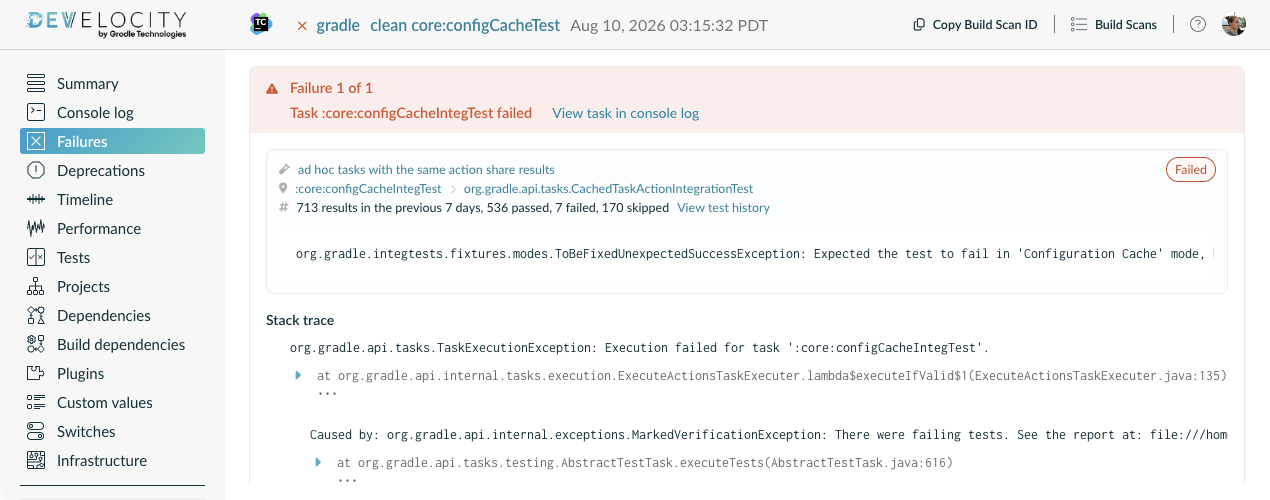
The full assertion and stack trace for the one test, no scrolling required. It is the same detail the bot reads to turn a bare group into CachedTaskActionIntegrationTest in the comment above.
The part we are quietly pleased with: the code for this does not live in gradle/gradle. No workflow file, no action, no YAML added to the repository everyone contributes to. It runs in the bot service that already listened for build results, so it landed on every contributor’s PR without touching a single line of the code those contributors work in. The place with the most eyes on it stayed exactly as it was.
And it fails soft. Missing token, slow API, a response it cannot parse: the summarizer returns nothing and the comment renders exactly as it would have without it. A missing summary is invisible; a summary that garbled the PR comment would be a support ticket. We chose invisible. As a bonus, that let us ship the feature before the access token even existed and have it politely do nothing until the secret showed up.
What we didn’t ship, yet #
One honest caveat, because this audience will absolutely check. In theory, the reason to point this at gradle/gradle was to dogfood cross-build analysis: establishing a baseline, and telling you whether a failure is new on your branch or was already broken on main. In practice, the shipped summary does not do that. It groups and names the failures in front of it. It does not compare them against history, and it will not tell you “this one is new.”
You saw the raw material a moment ago: the seven-day history sat right beside the failure in the Build Scan. The summary just does not pull it into the comment yet. That is the most useful version of this tool, which is exactly why it is the next one.
The parts worth stealing #
Strip away the specifics and a few things generalize to any internal tool.
Fail soft, so the tool can never be worse than its own absence. Ship it where the work already happens, so people meet it without changing a habit; this one appeared in the pull request they were already reading. Treat the output as untrusted, because failure text is arbitrary build output on its way into a comment. It goes in as data — never as instructions to the model or markup in the page. That is the sort of precaution that is tedious right up until the day it is not.
The summary now appears on failing gradle/gradle pull requests when Develocity can identify grouped failures, red Xs included. If you run Develocity, the ingredients are available from your instance: failure grouping, a failed check on the PR, and a query that ties the builds back to it. The same grouping is exposed through the Develocity MCP server, so an AI tool can read it the way the bot does instead of scraping a comment. And if you have built the “is this failure new?” part and made it actually work, we would very much like to compare notes. Ours does not do that yet. That is the next job.