Performance is a Feature
Table of Contents
Introduction
At Gradle Inc., we take build performance seriously. While we bundle performance improvements into every Gradle release, we’ve kicked off a concerted effort called a performance burst from Gradle 2.13 in order to make building software faster and more enjoyable for all of our users. In this blog post, we will explore how we approach performance issues, as well as what improvements to expect in the 2.13 release and beyond.
The fastest thing to do is nothing #
Building software takes time, which is why the biggest performance improvement is cutting steps out of it entirely. That’s why, unlike traditional build tools such as Maven or Ant, Gradle focuses on incremental builds. Why would you ever run clean when you don’t need to? For some developers, running clean became a conditioned response to a broken build tool. Gradle doesn’t have such an issue: aware of all inputs and outputs of a task, it is reliably capable of handling incremental builds. Most builds will be incremental, and that’s why we focus so heavily on optimizing this case. One way that we accomplish this is through the Gradle daemon.
The Gradle daemon can dramatically improve your build performance by allowing build data to persist in memory between build invocations and avoiding JVM startup times on each build. The daemon is a hot JVM hosting the Gradle runtime, making it possible to run subsequent builds much faster: instead of spawning a new JVM for each build, we can benefit from all the goodness of having a cached JVM – in particular, we realize a strong benefit from JIT (just in time compilation). While turning on the daemon has a cost for the first build, the amount of time that you will gain for each subsequent build more than offsets the initial cost. In Gradle 2.13, we focused our improvements when the daemon is activated, and we’re preparing to enable this by default in Gradle 3.0. Other performance improvements we’ve implemented will benefit all users, independently of whether they use the daemon or not (and if you don’t use the daemon yet, we strongly encourage you to try it out!).
As you can read in our release notes, we’ve emphasized several categories of performance improvements:
- reducing the build configuration time, that is to say, reducing the fixed cost of creating and configuring a Gradle build
- reducing the test execution time; i.e., reducing the overhead of Gradle compared to just executing tests in an IDE
- improving the performance of importing a project in an IDE
- reducing communication latency between the interactive Gradle client and the daemon process
Reducing configuration time #
Here’s an idea of the improvement you can expect:
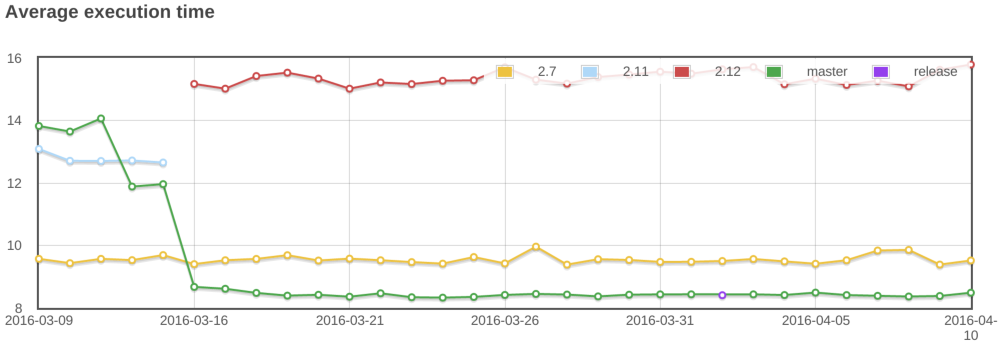
So the example above yields a typical performance test metric: we’re comparing the average execution time of a build when we run gradle help for a project that contains a lot of subprojects (10000 projects). You can see that when we started optimizing configuration time, the master branch was slower than Gradle 2.7. Now, Gradle 2.13 is faster than ever! We have measured up to 25% reduction on our own builds! However, more than the improvement, it’s how we get to this that is important. Improving performance is a process, and here is how it works.
Performance test suite #
The Gradle sources contain a sub-project dedicated to performance tests. This test suite is very particular, and allows us:
- to compare the performance of the
masterbranch with previous releases of Gradle - to compare various build scenarios against a single version of Gradle
So typically, in the example above, we’re comparing the average execution time of a build, when we run gradle help, in a specific scenario (an empty build with 10000 sub-projects), and compare it with previous Gradle releases. It’s worth noting that this performance test suite is executed daily, allowing us to catch performance regressions very early in the development phase.
Writing a performance test scenario #
So how, in practice, do we write a performance test? It all starts with a scenario we want to test. For example, we want to make sure that we reduce the duration of test execution. The first step is then to write a build template that will let us test Gradle against this scenario. And a template has various parameters: the number of sub-projects, the number of (test) classes in source, external dependencies, … This let us generate sample Gradle builds that are used to measure performance. Of course, those performance test builds are generated with Gradle.
All the graphs you see below were generated using fully automated performance tests, and aimed at testing specific scenarios. Should you find a performance issue with Gradle, this is a great way to get started: create a new template, then send us a pull request to show the problem. Of course, all our performance tests are regular test cases, which means that we can fail the build if we introduce a regression.
Since Gradle 2.13 is primarily a performance-enhancing release, let’s focus on some of the improvements.
Gradle vs Maven #
In this scenario, we are comparing the time it takes to execute gradle clean test vs mvn clean test. As we mentioned earlier, cleaning is not necessary in Gradle, but we do it here for the sake of comparison against Maven, and to assess the “cold build” time. Here are the results:
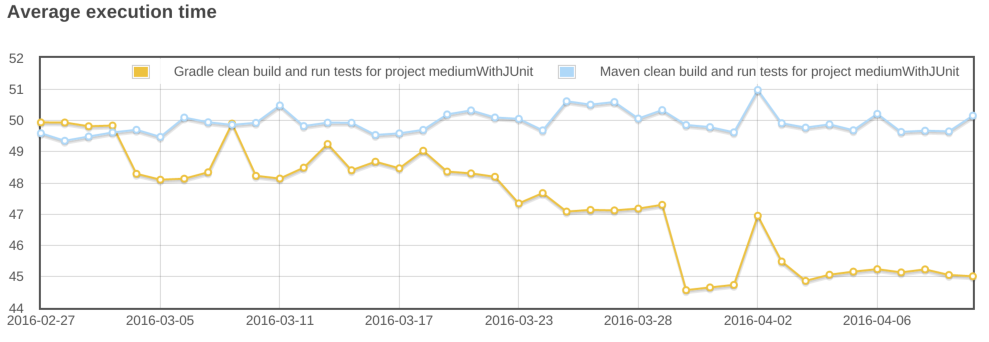
At the end of February, Maven and Gradle were comparable. Since then, the new performance improvements in Gradle 2.13 have resulted in a 10% speedup! You can notice that the graph contains some glitches: on April 2nd, you can see that the time considerably increased. However, it increased in both scenarios: Maven and Gradle. So what you need to keep in mind when reading such graphs is that results are relative between them for a same date. This is important because:
- we could change the templates between two executions of the performance build, resulting in an increase or decrease of the build time.
- we could change hardware between two executions, leading to the same side effects
Profiling is better than guessing #
So how did we manage to improve this? First of all, once a scenario is written and performance tests running, we need to profile the builds. For that purpose, we’re using different tools, from YourKit Java Profiler to Java Mission Control, the JIT logs or simply good old System.out.println statements. In the end, we try to identify what is causing slowdown and write a document summarizing our findings. Those documents are all public, and you can find them in our GitHub repository. Once we’ve identified hotspots and written down the profiling results, we extract stories for improvement and actually go to the implementation phase. This “profiling to stories” phase is very important, because while a profiler will be very helpful in identifying hotspots, it will be no help when it comes to interpreting the results: often, rewriting an algorithm can be much more efficient than trying to optimize a SAX parser…
Optimizing the communication between the daemon and the client #
As we explained, we’re primarily (but not only) focusing on improving performance when the daemon is activated. One issue with the daemon is that you have a forked JVM. When you run gradle, the client process, the one from the command-line, starts communicating with a long-living process, the daemon, which is effectively executing the build. And typically, to see the logs as the build is running, you need to forward events from the daemon to the client. Before 2.13, this communication was synchronous. This means that the log messages were sent synchronously between the daemon and the client. This was inefficient, because we were blocking on network I/O where we could actually perform some build operations. In 2.13, not only is communication asynchronous, but we also optimized the protocol that is used to communicate between the client and the daemon and how the client responds to these events.
Forked processes start up faster #
Another improvement that was made is visible in the following scenario:
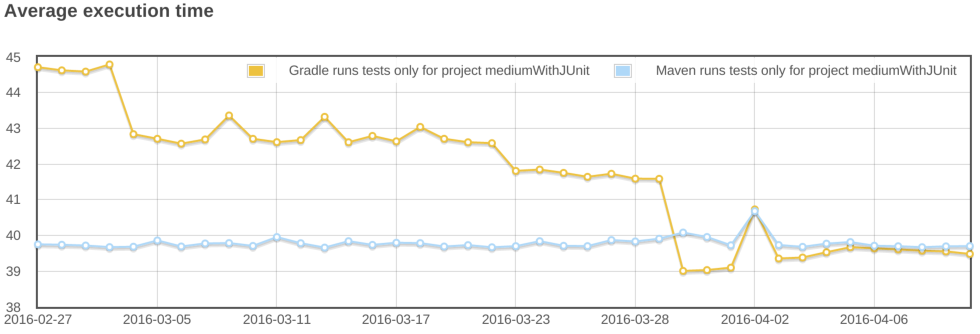
This scenario is “unfair” to Gradle, and meant to compare what happens when we just want to re-execute the tests. As you may know, when running mvn test, Maven will re-execute the tests even if nothing changed. Gradle does nothing in that case, because everything is “up-to-date”. So to emulate the behavior of Maven, we need to clean-up the test results so that we re-execute the tests and re-generate the reports. As you can see, in this scenario, Gradle was significantly slower than Maven. Now, it is faster, while doing also more work: Gradle not only runs the tests, but also generates 3 types of reports: a binary one, an XML one (for CI integration) and eventually an HTML report (for use by us, poor humans, but you can disable this behavior.) Gradle 2.12 is 15% slower in this scenario, and a large amount of improvement has been done by optimizing the classpath of the forked JVMs used for tests. In 2.12, almost the whole Gradle classpath was used on forked VMs, when in reality we just need a subset of Gradle classes (basically to communicate between the forked VM and the daemon). By optimizing this classpath, we can now reduce classpath scanning and significantly improve the time it takes to execute tests. If you ever noticed a “pause” when Gradle was about to execute tests, it has now gone!
Reports are generated in parallel #
Part of the improvement on test execution is also obtained thanks to parallel generation of reports. As we explained, Gradle generates more reports than Maven by default. This is usually what you want, because when you’re developing an application and run tests locally, having to decipher XML test reports can be very frustrating. With Gradle 2.13, now, the HTML and XML reports are generated in parallel, which significantly reduces the time required before starting the test suite of the next project. The more modules your project has, the more likely you will see a significant reduction in build duration.
Improving build startup time #
Faster script compilation #
When executing Gradle builds for the first time, you can see, as part of the “configuration” phase, that Gradle is actually compiling the build scripts. Despite being scripts, Gradle build files are written in Groovy and are nevertheless compiled to bytecode. This is time consuming, but has been optimized by the Gradle team. In particular, Gradle has to compile the scripts several times, with different classpaths, in order to compile scripts that contain references to remote resources such as plugins.
In Gradle 2.13, we changed the way Gradle scripts are compiled, and optimized two scenarios:
- running several builds concurrently from the same directory (this often happens on CI). Before this, the “script cache” that Gradle uses was locked during the execution of a build, so if a build script was changed during the execution of a build, all concurrent builds were locked until the first one finishes.
- re-use build scripts independently of their location. Imagine that you have multiple projects using the same remote scripts. This is typically the case in corporate environments, where a script defines some credentials, conventions, or plugins to be used in all builds of the company. Then, each project had to compile the script before being able to use it. Gradle 2.13 changed that, and now compiles script based on their actual contents (and classpath) rather than their location. It means that if you have 2 projects which have the same build files but in different locations, the script will only be compiled once. However, to be able to report build errors on the correct build file, we’re also using a “relocation technique”, which takes a compiled script class and remaps it to an actual script file so that errors are reported correctly.
Optimized classpath #
Another work that has been done in 2.13 is improving the classpath of Gradle, so that services are located faster. When you have a lot of jars on classpath, ordering is important, and the number of classes is important. Even if you “only” gain 10ms, it can lead to significant differences when builds are often executed, in particular from the IDE, which leads to the last area of improvement we worked on in 2.13.
Bugfixes #
Sometimes, improving performance is a matter of serendipity. We recently discovered that some performance tests were executing significantly faster on our CI server than locally, but were unsure of the cause. After doing some profiling, we realized that the code to propagate properties from the various gradle.properties files to the actual Project was very inefficient: the more properties you had in your various gradle.properties file, the longer it would take to start the build! We identified the problem and fixed this.
Faster IDE integration #
The Tooling API typically allows IDE vendors to integrate Gradle. This is what we do with Buildship. It has very specific needs and in particular, it has to be both backwards and forward compatible, meaning a certain version of the TAPI can execute Gradle builds for both older and newer versions of Gradle. Of course, a developer would only benefit from the latest improvements by using both the latest version of the Tooling API and Gradle, but it leads to interesting architecture.
In this case, the Tooling API heavily relies on reflection to invoke methods. In Gradle 2.13, we significantly improved caching, which led to spectacular results:
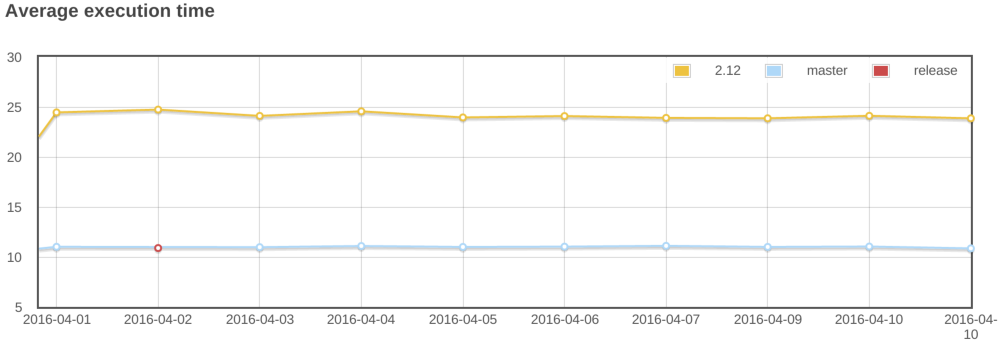
This scenario illustrates how long it takes to import, typically, a 500 sub-projects build into Eclipse. While it took 25s with the 2.12 version of the Tooling API, it’s now only 10s. And you can even see more spectacular results in IntelliJ IDEA, where they are using “custom models”. Imports/synchronizing projects would then be orders of magnitude faster.
There’s more to come! #
We cannot close this blog post without illustrating what we mean by “doing nothing is better”. In the Maven vs Gradle examples above, we’ve tried to “emulate” the behavior of Maven with Gradle. Here is, typically, the graph that you would get when running proper incremental builds with Gradle. That is to say that you open and edit several files from different sub-modules then re-execute the tests. Remember, with Gradle, you no longer have to clean, but we were fair and didn’t clean with Maven either:
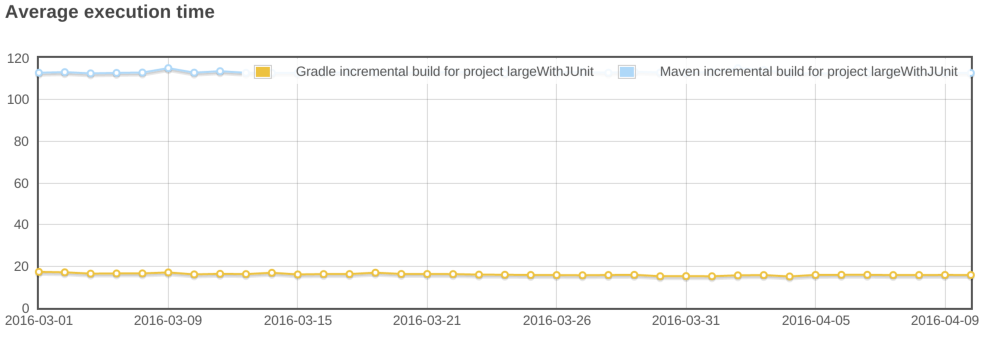
Yes, Gradle is almost 6x as fast in this scenario. So now, imagine doing this 10, 100 times a day, multiplied by the number of developers in your company. And realize how much money it is.
Thanks for reading this, and don’t worry: there’s more to come, stay in touch for more performance improvements in Gradle 2.14!