Essential Tips for Gradle on Ephemeral CI Environments - Part 3


Table of Contents
Introduction
In Part 1 and Part 2, we optimized Gradle’s Startup and Configuration phases on ephemeral CI.
In this final part, we reach the Execution phase: the point where Gradle checks whether task outputs can be reused and, when they cannot, runs the selected tasks. This is where the Gradle Build Cache becomes the main lever.
Benchmarking Performance in Ephemeral CI #
The methodology is unchanged from Part 1 and Part 2: each scenario builds a fresh Docker image of the Spring Boot Project with --no-cache, base images are pre-pulled, and every figure is the average of ten runs against one consistent baseline. Individual runs vary by a second or two, so read small differences as approximate rather than exact.
These numbers are not intended as universal Gradle performance claims. They show the relative impact of execution-phase optimizations for one small Spring Boot project, one Gradle version, one JDK image, and one local Docker environment. Larger builds, especially multi-module builds with expensive compilation, testing, code generation, or packaging tasks, will generally see bigger gains from task-output reuse than this sample project does.
NOTE: All measurements in this post are pinned to Gradle 9.5.1. If you repeat the experiment with a newer Gradle version, rebuild the prime image and update any version-specific cache paths accordingly.
The baseline (no optimizations) averaged 32.3s over ten runs, in line with the ~31.5s baselines from Parts 1 and 2.
Optimizations for the Execution Phase #
During the Execution phase, Gradle runs the task graph that was selected and ordered during configuration. For each task, Gradle decides whether work can be avoided before it executes task actions:
- Input and output snapshotting: Gradle fingerprints the task’s declared inputs, outputs, and relevant implementation details.
- Reuse checks: Gradle determines whether the task is already up to date locally, or whether matching outputs can be loaded from the Build Cache.
- Task action execution: Gradle executes the task only when its outputs cannot be reused.

The big opportunity is avoiding task execution altogether. On ephemeral CI, local outputs disappear with the runner, so making task outputs reusable across builds is the difference between doing the same work repeatedly and restoring work that has already been done.
The Build Cache #
The Build Cache stores the outputs of cacheable tasks, such as compiled classes, generated sources, processed resources, and packaged artifacts. Each entry is keyed from the task’s inputs and implementation details. When a later build runs a cacheable task with the same effective inputs, Gradle restores its outputs from the cache instead of executing it.
This is different from the caches in Parts 1 and 2: those stored the Gradle distribution, downloaded dependencies, and compiled build scripts. The Build Cache stores the work your tasks produce.
It comes in two forms: a local cache on disk (build-cache-1), and a remote cache shared across machines.
#1 Save and Restore the Local Build Cache (build-cache-1) #
Gradle stores local build cache entries in <GRADLE_USER_HOME>/caches/build-cache-1. In ephemeral CI this is wiped between builds, so cached task outputs are lost unless you restore that directory.
In the benchmark, we prime the cache by building once with --build-cache, then restore build-cache-1 and build again with --build-cache so Gradle can reuse the cached outputs:
FROM eclipse-temurin:17-jdk AS build

WORKDIR /app
COPY . .

# Restore the local build cache from the prime image
COPY --from=gradle-cache /root/.gradle/caches/build-cache-1 /root/.gradle/caches/build-cache-1

# Build with the Build Cache enabled so cached task outputs are reused
RUN ./gradlew build --build-cache --no-daemon

# Extract the built JAR
RUN mkdir -p target && cp build/libs/demo-0.0.1-SNAPSHOT.jar target/app.jar

# Run Spring Boot app
CMD ["java", "-jar", "target/app.jar"]
Resulting Build Time:
[+] Building 28.9s (12/12) FINISHED
| Scenario | Build Time |
|---|---|
| Baseline (No caching) | 32.3s |
| Optimized (Local build cache) | 28.9s |
| Total Time Saved | 3.4s |
Restoring the local build cache reduced build time by about 11%, reusing cacheable task outputs instead of recomputing them. For a single-module app, that’s a handful of quick tasks, so the win is modest. It grows directly with the number and cost of your cacheable tasks: large multi-module builds with heavy compilation, code generation, test, and packaging work can skip far more.
#2 Use a Remote Build Cache #
A local build cache helps only when the same machine, workspace, or restored Gradle User Home sees the same task again. A remote build cache is shared across runners and developer machines, so one build’s task outputs can accelerate another build that starts from an empty environment. That cross-runner reuse is what makes the Build Cache genuinely powerful on ephemeral CI.
You can self-host one with the Gradle Build Cache Node:
docker run --detach \
    --name gradle-build-cache \
    --publish 5071:5071 \
    --volume $HOME/.gradle-cache:/data \
    gradle/build-cache-node:latest
And use the UI to configure it:
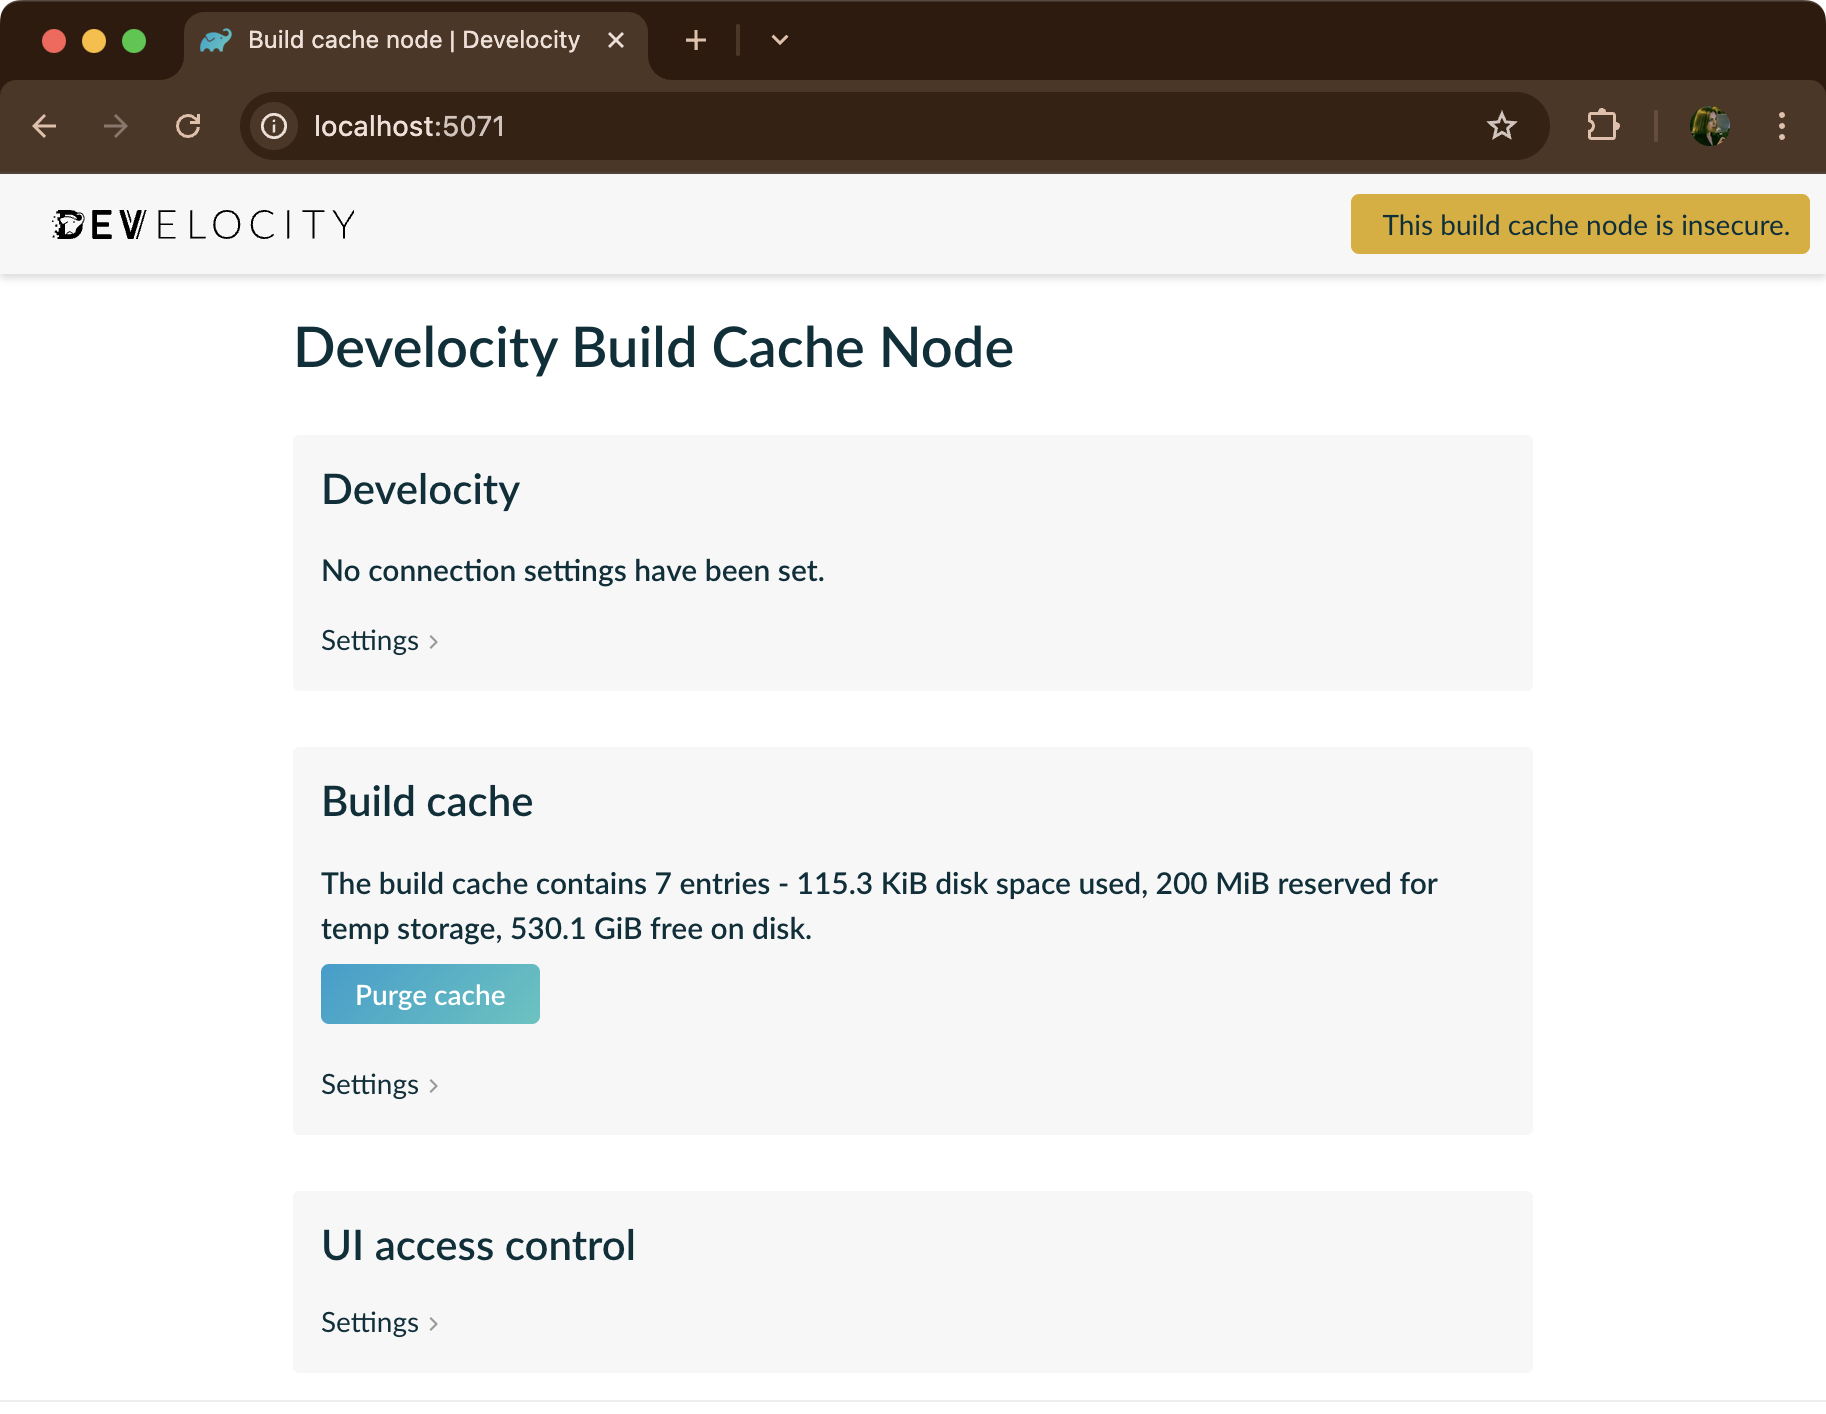
⚠ Disclaimer: In this experiment, the Gradle Build Cache Node runs over HTTP for quick experimentation. This is not recommended for production environments—use HTTPS for security.
Then point your build at it in settings.gradle.kts:
buildCache {
    remote<HttpBuildCache> {
        url = uri("http://host.docker.internal:5071/cache/")
        isAllowInsecureProtocol = true // for local experimentation only; use HTTPS in production
        isPush = true
    }
}
We don’t attach a benchmark number to the remote cache here, and that omission is deliberate. On a single-module sample, the task outputs are tiny and quick to recompute, so a network round trip to a remote cache can be neutral or even slower. That would say more about the sample than the feature.
The remote Build Cache earns its keep on larger builds and, above all, across many runners sharing one cache. Sizing that cache, securing it, and observing its hit rate is exactly the operational work a managed cache takes off your plate, which we return to below.
Two More Execution-Phase Caches #
Two further directories are worth knowing about. We describe them rather than benchmark them, because both need a project shape our small sample doesn’t have.
Artifact transforms (caches/transforms-3). Gradle’s artifact transforms produce derived artifacts, such as exploded AARs or processed classes, and store the results in caches/transforms-3. They’re used heavily by the Android Gradle Plugin, so transform caching matters most for Android builds. When your build relies on transforms, restoring transforms-3 (or letting tooling cache the Gradle User Home for you) avoids recomputing them on every ephemeral run.
Provisioned toolchains (jdks). With Java toolchain auto-provisioning, Gradle downloads JDKs on demand and stores them in <GRADLE_USER_HOME>/jdks (note: jdks, not caches/jdks). On ephemeral CI, each build re-downloads any JDK it needs unless that directory is cached. The simplest option is to bake the required JDK into your runner image; when a build needs a JDK that isn’t in the image (for example, running tests on a different Java version), caching ~/.gradle/jdks avoids repeated downloads.
The Problem with Manual Caching #
By now the pattern from Parts 1 and 2 is familiar: every manual optimization is another COPY --from line, another cache to key and invalidate, another thing to maintain across every project and CI system. Standing up and securing a self-hosted Build Cache node adds more operational work. And when a build slows back down, working out which cache stopped being restored is a frustrating hunt.
As before, there are two ways to get the execution-phase wins without owning the plumbing.
If your builds run on GitHub Actions, the setup-gradle action handles Gradle User Home caching from a single workflow step, including the wrapper, dependency, script, and transform caches discussed across this series. It’s free, maintained by Gradle, and removes the need for custom cache-copy logic in your Dockerfiles or workflows. For task-output reuse, pair it with the Gradle Build Cache; use a remote cache when you want reliable reuse across ephemeral runners.
For a shared, cross-runner cache on any CI, the Develocity Universal Cache provides a managed Build Cache: a remote cache that CI jobs and developer machines can read from and write to, without you hosting, sizing, or securing a node yourself. Cache hit rates and task-level activity are observable per build through Build Scans, so instead of guessing why a build got slow, you can see which tasks missed the cache.
That completes the trilogy. Across this series, Develocity’s Universal Cache maps cleanly onto the three phases: the Setup Cache (startup, Part 1), the Artifact Cache (configuration and dependencies, Part 2), and the Build Cache (execution, this part).
Wrapping Up the Series #
Ephemeral CI trades away persistent state for clean, isolated, reproducible builds, and pays for it in repeated work on every run. Across the three phases we measured, the biggest levers for our small Spring Boot project were:
| Phase | Optimization | Improvement vs. baseline |
|---|---|---|
| Startup | Primed image (wrapper + first-use runtime files) | ~24% |
| Startup | Cache the wrapper dists directory |
~22% |
| Startup | Gradle image, built with gradle build |
~21% |
| Startup | Local mirror for the distribution | ~18% |
| Startup | Cache generated-gradle-jars |
~5% |
| Configuration | Cache dependencies (modules-2, or a read-only cache) |
~28% |
| Configuration | Cache compiled scripts (kotlin-dsl) |
~10% |
| Configuration | Cache processed JARs (jars-9) |
~0% (neutral) |
| Execution | Local build cache (build-cache-1) |
~11% |
Baselines ranged from ~31.5s to ~32.3s across separate runs; treat the percentages as approximate. Full methodology and per-scenario numbers are in the individual posts.
A few closing principles:
- Dependency and startup caching gave the biggest wins here. For most projects, caching dependencies and priming the distribution are the highest-value, lowest-risk places to start.
- Some caches scale with your build, not our sample. The Build Cache (execution) and script caching (configuration) were modest on a single-module app but grow with build size; on large builds they can become the dominant win.
- Not everything is worth caching by hand. Processed JARs alone were neutral, and per-project cache plumbing is a maintenance cost in its own right.
- Let tooling own the plumbing.
setup-gradleon GitHub Actions, or Develocity’s Universal Cache for any CI and any build tool, delivers these wins without hand-maintained Dockerfiles, and makes cache behavior observable instead of mysterious.
Gradle runs well on ephemeral CI. The trick is to stop paying, on every disposable run, for work you’ve already done, and to let the right layer of caching, from a simple -bin distribution to a shared Universal Cache, do that for you.
⚠ Disclaimer: These results come from controlled experiments in one ephemeral CI setup (one small project, one Gradle version, one JDK image, one local Docker environment). Actual gains vary with project structure, dependencies, network, and CI environment. Run your own benchmarks before adopting any of these optimizations.